by Grace Lee Kang, freelance writer
What do wheeled luggage, wearable breast pumps, and a tool mapping the most polluted spots in Puget Sound have in common? They used design thinking, a creative approach that centers the human need behind the problem, to come up with an innovative solution. An iterative process favored by both startups and some of the world’s leading brands, it was a crucial part of developing the new Stormwater Heatmap, an interactive mapping tool, report generator, and data repository that quantitatively visualizes hotspots of pollution generation and runoff throughout the Puget Sound watershed.
Water, Water Everywhere
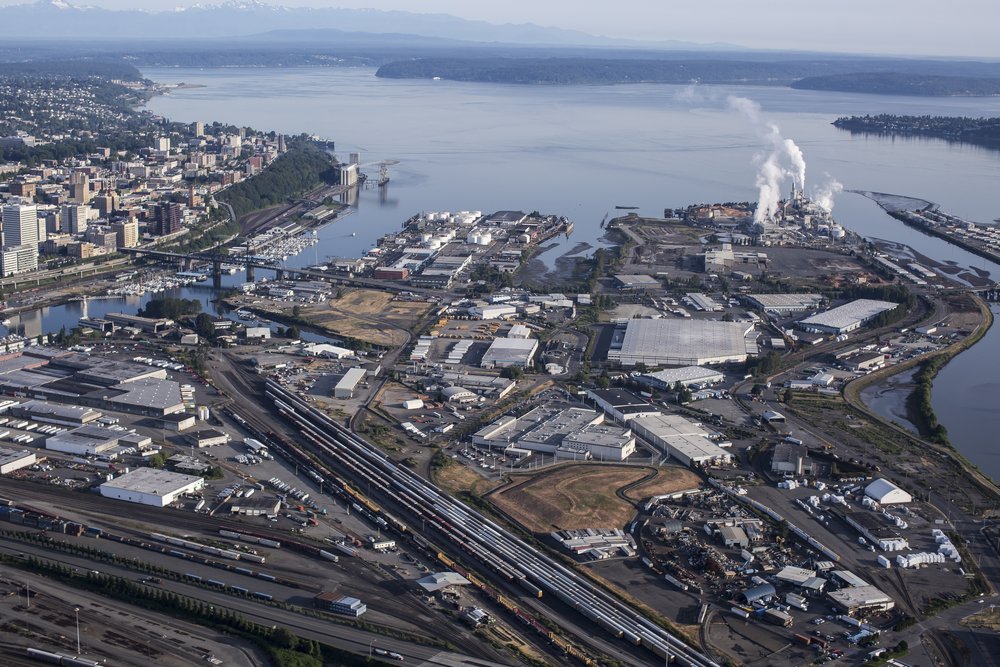
Just one acre of pavement can discharge up to one million gallons of polluted runoff into Puget Sound each year. Photo by Hannah Letinich.
When rainfall runs across hard, impervious surfaces like streets, sidewalks and parking lots, instead of soaking into the soil, it picks up and washes toxic contaminants into nearby streams, rivers, and eventually the Salish Sea. In the rainy Pacific Northwest, that means that stormwater is all around us. Just one acre of pavement can discharge up to one million gallons of polluted runoff into Puget Sound each year. It’s the water running off our roofs, leaching metals. It’s on our sidewalks, picking up excess nutrients from lawn fertilizers. It rushes off cars and roadways, carrying oil, tire dust, heavy metals, and other emissions into streams, rivers, lakes, and marine waters.
Puget Sound Sources of Pollution: Rainfall turns from a natural resource to a vehicle for pollution when it hits the hard ground. It flows on top of paved surfaces to nearby rivers and streams picking up toxic contaminants that are harmful to people and nature. Infographic: Erica Sloniker/TNC.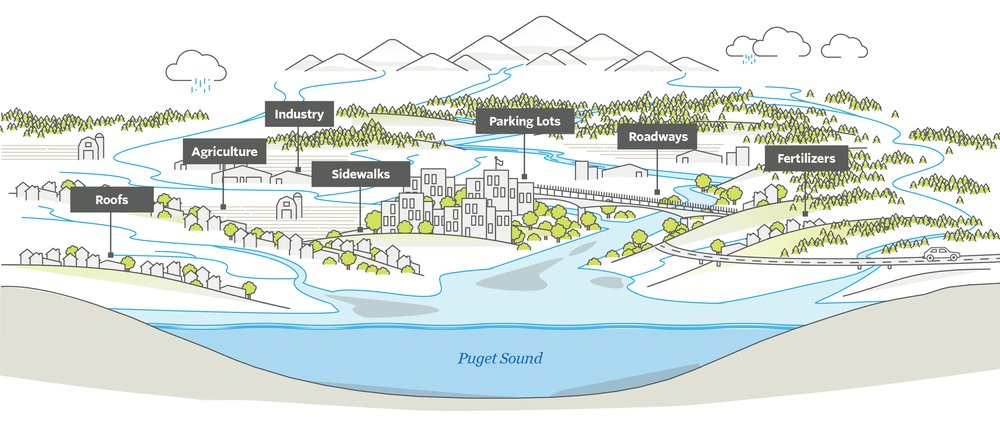
It’s the leading source of toxic pollutants to the beloved Puget Sound, with 370 billion gallons of untreated stormwater flowing into it every year. A harmful mix concentrated from roads, sewer pipes, and impervious, urbanized landscapes, it affects both freshwater and marine species like coho salmon and orca whales, as well as people. It doesn’t take a lot to be affected by untreated stormwater—any watershed with greater than 5-10% impervious surface area is impaired, with serious ecological impacts. Virtually all urban watersheds and marine receiving waters suffer from “urban stream syndrome”, a condition that leads to low abundance and survival of sensitive species, the closure of swimming and shellfish beaches, nuisance flooding, and sewage overflows. And, since stormwater impacts are linked to the spread of impervious, urbanizing surfaces, this isn’t just a local problem—it’s a growing global and national issue as well.
Video: By making the invisible visible the Puget Sound Stormwater Heatmap is designed to help communities take targeted, high impact action on rolling back a legacy of pollution.
>
“What decisions can we make differently if we knew where the pollution was worst?”
As population and development continue to grow in Washington, stormwater has become an overwhelming challenge for stormwater practitioners. Not because there isn’t a solution (see: green infrastructure), but because of the billion dollar question — where are the most polluted areas and how do we prioritize them? Stormwater collects and concentrates pollution as it flows from disparate sources towards waterways, making it difficult for municipalities and communities to track where it’s actually coming from. Without a map identifying where stormwater runoff and pollution loading are highest, deciding where to site infrastructure improvements that best support native species, ecosystems, and human health had no easy answers. Developed areas in particular, with greater concentrations of impervious surfaces, could benefit from more informed planning when it comes to urban flooding and infrastructure protection. When The Nature Conservancy began this project, there was a clear need for a tool to help regional stormwater practitioners pinpoint critical areas for infrastructure improvements.
Design Thinking in Action
The design thinking process centers the users first and foremost — in this case, the stormwater practitioners. To develop a successful stormwater decision tool, we had to first accurately define the problem. We interviewed and brainstormed with stormwater leaders and engineers across three cities, four counties, and two conservation districts to learn about their experiences and get to the heart of defining what a solution would address. What might make or break this tool in terms of success? What do stormwater practitioners need in order to identify where and what kind of green infrastructure to implement? We answered those questions and more:
We interviewed and brainstormed with stormwater leaders and engineers across three cities, four counties, and two conservation districts to learn about their experiences and get to the heart of defining what a solution would address. Photo: Bobby Hughes/Aardvark Designs.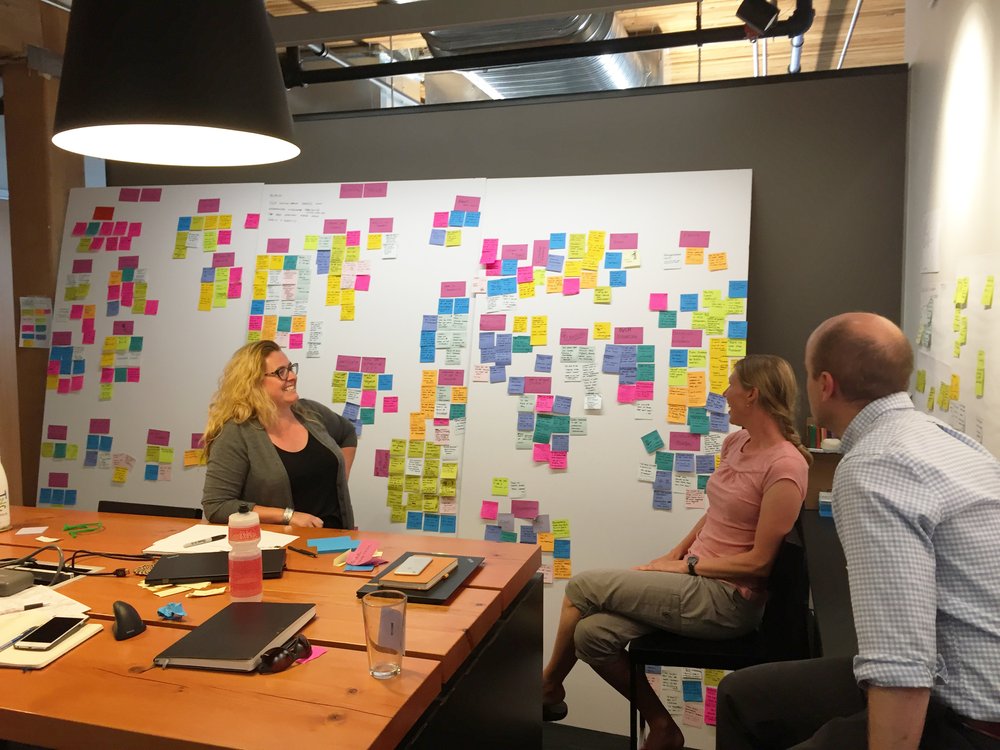
Accurate, High-Quality Data in One Place
To model stormwater flows with certainty, stormwater practitioners need accurate, actionable information and a lot of it. Yet with the sheer volume and decentralized nature of the existing data, there wasn’t a way to scale it up and out from the places where it was collected. To be useful, the Stormwater Heatmap needed to statistically link pollution measurements with landscape features, things that could be objectively measured. The data and calculations also had to be apparent and meet best scientific practices.
With access to the power of the Google Cloud Platform, we could harness tools like Google Earth Engine and BigQuery. We could integrate and efficiently compute disparate data sources, housing 30 billion lines of hydrology output data across Puget Sound alone. Hydrologic output data for hourly timesteps is now run for every hydrologic response unit that exists in Puget Sound, and over historical, current, and future climate conditions. They are run on the one square meter resolution landcover foundation layer we generated with collaborators, an undertaking that took over a year alone! From a watershed spanning thousands of square miles to a parcel covering a few square meters, the Stormwater Heatmap offers land cover, hydrology, and pollutant loading data layers that can assist with any scope of planning.
A Predictive Model for Pollution Loading
Currently, different pollution loads are assigned to different land uses like industrial, commercial, high density residential, or low density residential. These are subjectively assigned depending on county or jurisdiction. Our approach was to find statistical relationships between measurable landscape features (e.g., traffic amount, amount of impervious surface, amount of rooftops, CO2 emission estimates ), and then use those relationships to predict pollution load elsewhere.
The results spoke for themselves: our new method outperformed the current method for nearly every pollution type we modeled. Better yet, we can extrapolate pollution loading from areas where stormwater modeling is done to areas that don’t have a monitoring requirement or the funds to do it. This predictive method, using objectively measurable datasets, is a major step forward in stormwater management.
Compelling Visuals, On Demand
Fun fact: stormwater practitioners are also storytellers. Whether it’s taxpayers, regional funding bodies, or the city council, practitioners must translate huge amounts of technical data and findings into accessible, compelling stories. The heatmap does the heavy lifting for them, generating visuals and reports to bring the numbers to life.
A screenshot of a single watershed and associated land cover metrics from the stormwater heatmap.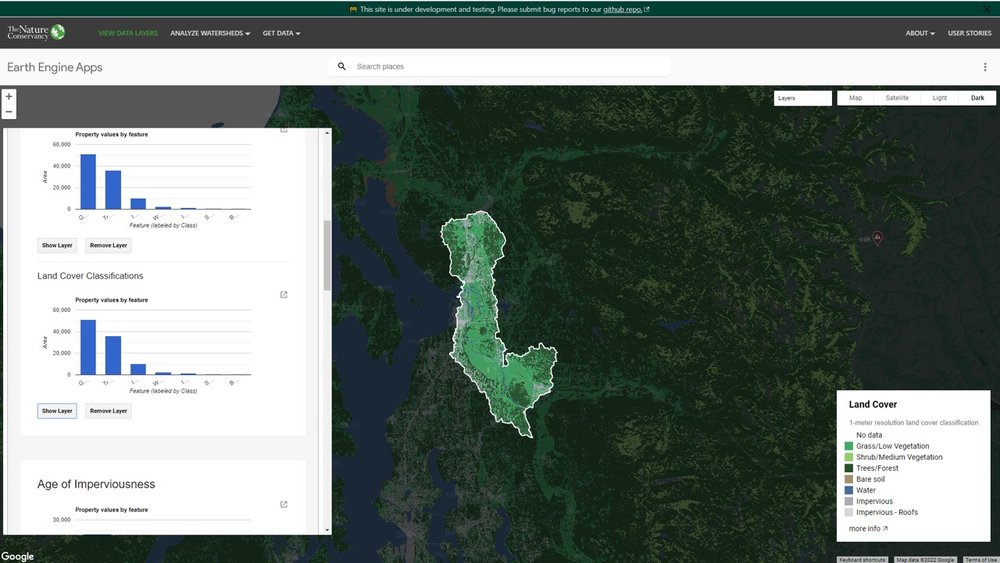
Zoom In (And Out)
Stormwater management happens at different scales, from large watersheds to local neighborhoods. The interactive nature of the heatmap lets anyone look at the big picture while also zooming in to explore parcel by parcel. The scalability of data provides new and rigorous insights into where infrastructure investments are needed in order to buffer against the environmental impacts of stormwater pollution.
Downloadable Data
Finding all the data layers (e.g. soil, precipitation, slope) needed to do a stormwater assessment can be a huge undertaking. Serving as a data platform and resource for use with other tools, the Stormwater Heatmap’s 29 spatial data layers, and accompanying images and reports, are downloadable for use outside of the online tool — and all the code is open source, encouraging others to adapt it for their own use.
>
“Knowing pollution loading itself is only half the story. This tool provides a quantitative foundation of pollution loading and stormwater runoff across the Puget Sound watershed. With this foundation in hand, we can now begin to intersect this information with ecological and human health needs to identify high impact green and gray infrastructure investments that service both people and nature.”
The Stormwater Heatmap in Action
Since 2016, when we first started working on the tool, the Stormwater heatmap has been adopted by several local organizations, giving us valuable feedback on how to improve the tool and even showing unexpected uses.
Building Lower Cost Stormwater Management Action Plans (SMAP)
In 2020, the Our Green/Duwamish Coalition produced a mapping tool called SMAPr using data from the Stormwater Heatmap. SMAPr was designed to support meeting the minimum regulatory requirements related to watershed planning (as described by the NPDES). The heatmap’s ability to complete a pairwise analysis of local drainage basins allowed users to weight land use characteristics like traffic, tree cover, or imperviousness and then rank each basin by priority. Comparing one land use characteristic to another is challenging and this function allows for the type of flexibility and understanding of local issues required by NPDES permittees to make responsible use of limited resources.
A Time-Saving Solution for King County’s Fish Passage Restoration Program
King County was challenged with predicting stream flows at specific culverts so they could model velocity, water surface drop, and water depth for each culvert — critical information needed to determine if a culvert was a fish passage barrier or not. The Stormwater Heatmap provided detailed hydrologic information across the Puget Sound landscape, including many small and urbanized basins, that allowed better flow estimates.
>
“We were able to do a culvert/fish passage analysis in a few months, which previously would have taken a team of four hydrologists two years to accomplish.”